
Back to school: it’s September. It’s that time of the year when we rethink how we teach our courses. Well, actually we might have done the re-thinking over the summer break and now start re-doing actually.
At Bocconi, I was the guy to teach marketing research for the past two years. For some reason, many of the undergrad marketing research courses ended in my hands. When I took them over, I did the usual thing: I studied the previous professor’s course layout and I did a benchmarking with other schools. Partly friends, partly via Google. Then I started teaching and my first attempt was okay, but not great. The main issues that I faced were:
- The standard material used by many schools feels outdated in a 2018 marketing research world. There’s too much emphasis on qualitative data and surveys.
- The traditional group project requires a lot of supervision to succeed and bears a high risk of frustration, backing out, and limited learning.
- As always when there’s group work involved, free-riding occurs.
After three years, I think that I’ve fixed all of these issues. With this post, I want to share the new course structure which I adopted. I attached the syllabus to the bottom of the post. Feel free to reach out to me and ask for slides.
Honor to whom honor is due: These changed had not materialized without linguist Dirk Hovy joining and inspiring our marketing group and without my colleague Sungtak Hong demonstrating that advanced analytics work on an undergraduate level. Sungtak and I taught marketing research together in 2017 and I built my course in spring 2018 based on our joint experiences.
Where we started: A classic marketing research course
On the undergraduate level, textbooks remain a prevalent choice for many. In marketing research, very many of us rely on some version of Naresh Malhotra’s text. It’s obviously not Malhotra’s fault that marketing research went through a light-speed evolution in these past years. The field has changed faster than what the pace of a normal publishing cycle can keep up with.
From one edition of the book to the next, what should form part of a basic marketing research introduction changes massively. What does form part can only change slightly. Path-dependency also plays a role. (Do you really feel like throwing away chapters that have been good enough for past editions and to rewrite them from scratch?) Thus, the next paragraph is not a specific criticism, but an example to illustrate a general point.
Yes, there’s a bit about online in Malhotra’s latest edition (it’s the 8th edition). Big data and web analytics account for five pages (of about 900). Qualitative research fills and survey-related chapters fill 120 pages each. Social media research and mobile research make up for about 40 pages. Many marketing research courses outsource the statistical part to a proper statistics class. In any case, Malhotra’s book doesn’t cover predictive analytics at all.
When setting up a course based on a textbook, I can only deviate that much from the text. Otherwise, there’s no point of using a text at all. (Ultimately, that’s a main reason as to why I dropped the textbook.) My course structure was therefore closely following the book.
The course included a component of inquiry-based learning (IBL) approach:
Over the course of the project, there will be three checkpoints for the field project. At the first checkpoint (after four weeks), you will submit your research proposal (~2 pages). At the second checkpoint (after six weeks), you will submit your research design or questionnaire. At the third checkpoint (after ten weeks), you will discuss your plan for analysis and presentation with me. On the Friday of the last week of classes, you have to submit the final output. You will earn 10% of your final grade from the first checkpoint, 10% from the second checkpoint, and 30% from the final output.
Students had to identify a research problem themselves. Some groups got into trouble here and never recovered. Qualitative feedback was full of complaints of students that felt lost. In the next running of the course, I changed that: Each group did a version of the same project and I introduced them to the research problem at the beginning of the course.
On top of that, these group projects cluster work at the end of the term. At the beginning, I need to lay the foundation. Their work realistically only takes off after the first third of the term has already passed. Then, towards the end, they need to have a feedback talk with me and they need to hand in the report. They also need to prepare for the exam. Very likely, they have other assignments due at the end of the semester in their other courses. This is not a balanced workload.
What I wanted: a progressive introduction to marketing research
At Bocconi, we recently started our own bachelor in data science and business analytics. The motivation for this program: we recognize that these are skills that companies look for in their new hires. Of course, they need not only data scientists. Yet those who they hire for other positions nonetheless need to be able to collaborate with data scientists. They need to instruct them and they need make use of their results.
I do think that qualitative research and surveys still have a role in marketing research. However, they cannot dominate our marketing research teaching if in fact they don’t dominate the field anymore. For many, marketing research might be about the only marketing methods course they’ll ever take. This course has to find a better balance.
For example, natural language processing is not just the latest craze, but here to stay. But what exactly is natural language processing? Same with big data. I’ve simply polled my students. In 2016, few had an idea what big data is. In 2018, many did. One had a vague idea of natural language processing.
Experimental design: Can we just stop at teaching them about the need of control groups? A/B testing might be little more than putting fresh labels on old principles. Yet it’s the terminology they’ll be exposed to in business practice. Their firms won’t have a lab, but they might use Amazon MTurk. They might run field experiments and they might use results from experiments.
Finally, predictions. For good reasons, at universities we have and still do focus on causal analysis. We typically do not teach predictive regression analysis on the undergraduate level. Often, we don’t even mention it. And then again, the field is moving in a perpendicular direction: prediction has a huge value. Good university graduates master both and know the limits of either and the interplay of both.
Only that it wasn’t the final point yet. (For what it’s worth, it stands as an example of my inferior personal prediction. Then I remembered and updated my prediction with new data. Anyways.) On the behavioral “side” of marketing, the replication crisis questioned the integrity of our findings. Two years ago, my students were followers of Amy Cuddy and impressed with her power posing research. They should know not only that her research faced criticism, but that hers is part of a wider debate. They need to understand and learn how to read, scrutinize, interpret, and apply findings of existing research.
How I did it: a modern curriculum
With these premises in mind, I restructured the curriculum from above for the spring term 2018. Qualitative data (two sessions instead of three) and surveys (three sessions instead of six) are still there. Sessions in Italy usually last 90min. However, as the spring term looses some sessions to public holidays, every second session was 45min longer.
This sequence partly originates from the schedule constraints of my co-instructor. He’s a behavioral researcher and so we thought he’d be most credible to teach design of surveys and experiments. In retrospect, this was a good move. Now the course basically has three blocks: exploratory research, descriptive research, and causal research.
Long sessions give me an opportunity to demonstrate applications. Typically, this application would highlight the mechanism of the method that we’ve discussed previously. To that end, I use public data sets. I retrieved many of them from Kaggle. At the end of the demonstration, we will have answered a simple research question. On top of this, there’s an assignment.
For instance, we used wine reviews to demonstrate simplistic natural language processing. Wine reviews come with a score and they come with a verbal feedback. Say you compare good wines with bad wines: does the language change? We took a random sample of wine reviews and selected adjectives that reviewers used to describe wines. With this dictionary, we calculated the average wine rating score of reviews that contained a specific word. We then compared and identified words that reviewers use for better and worse wines. (Interesting take-away: “a bit” and “slightly” express similar concepts, yet “sligthly” indicates a much better wine on average.) A few sessions later, I came back to the example and we predicted the wine rating of wines for which we only had the verbal review. Sure, it’s far from current practices in natural language processing. It’s rough, slow, and manual. It serves the introduction.
In this case, the assignment asked them to work with hotel reviews. I asked them to identify which elements of a stay would contribute more or less to the overall review score of a hotel. I also asked them to assess the positive and negative sentiment of some individual reviews based on their own dictionary. The first part of the assignment purely replicated the in-class exercise; for the second part, they got a hint from me, but had to implement the solution themselves.
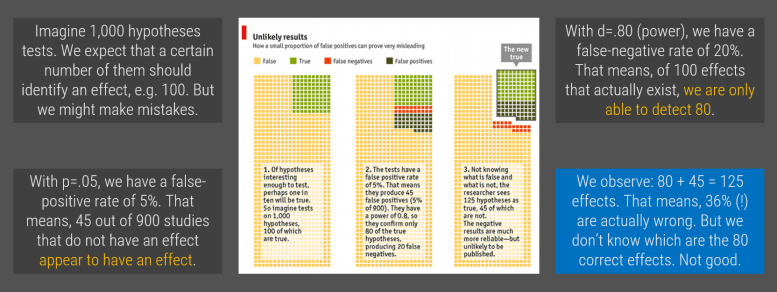
With the pen-ultimate session, I cover the replication crisis. At the start, I ask them a simple question: what’s a p-value. We get an idea. I ask them which p-values are more likely. They usually don’t know. I show them a graph where p = .05 is the big outlier. They get an idea. We use a tool of 538 to play with different specifications of the same model to illustrate that you could make almost anything significant with a little bit of effort. After p-hacking and publication bias, we talk about type II errors. (The readings include an article of The Economist on the matter.) We finally talk about Amy Cuddy and Brian Wansink and develop some ways to cope with the problem.
I also changed the assignment structure
There’s an assignment every week except the first and last. With ten weeks, this sums up to eight assignments. Maximum. In fact, they only have to submit four.
Eight assignments is a lot, even if each individual student takes just half of them. But here’s the thing: we need to understand that students have other things to do as well. It’s not just our course. In the end, weekly assignments give them a chance to structure their workload as it fits their schedule. I rely on their maturity. They are above 18. They are legally allowed to drink and get totally wasted. I don’t think it’s wrong to expect that they can take decisions. And that’s exactly what I tell them.
They have to submit four assignments. If they are not satisfied with the grades, they can submit more than four assignments. I would count their best four attempts. Half of the students finished with four assignments. Half of the remaining half submitted a fifth assignment. The rest submitted less and switched to non-attending.
They can submit assignments as groups or individuals. They may switch their group every week. If people prefer to work alone: I don’t mind. I want them to learn in their best way possible. They’re exposed to group work elsewhere. If people encounter free-riding: I mind. They shall just have a chance to change the team. Group participation did change a little in the first three weeks. Eventually, students found the peers they worked best with.
A note on software
Focused on analysis, we need to use software. Note that this course traditionally has a very high share of exchange students. Therefore, the software they’ve been exposed to varies a lot.
In my case, the only safe choice is Excel. I cannot add a tutorial in R to the course. Even Excel can impose a problem, as Apple’s devices need to have at least Office 2016 installed. Prior to that, only Windows systems could access the Analysis Toolpak. I use Excel for everything, including conjoint and natural language processing. (This limits what I can do, but it serves the purpose of an introduction. They understand the mechanism.)
In the past, I had worked with analysis plugins for Excel as well as with PSPP and a cloud-based version of SPSS. I run into technical issues with all of these approaches. One class, I found myself reverting back from SPSS to Excel on the fly. Too many students could not initialize SPSS on their computer.
There’s one exception in which I still deviate from standard Excel. For the exercise on coding qualitative data in session 4, I used the free demo version of Atlas.ti. It exists (and works) for both Windows and Mac, though the user interface on Mac is vastly different.
Take-away: Keep marketing research courses relevant
When I went to school, I learned about principles of quantum physics in 9th grade. My Mum had covered them in 12th grade. A few years earlier, someone won a Nobel prize for them. Now Richard Thaler won the Nobel prize. Marketing research evolves the same way. Our own toolbox grows. At the same time, we don’t necessarily get more time to train our students. We have to carefully consider what we teach them. The curriculum needs updates. We’re in a period where this might exceed the incremental steps of how text books can change.
Final note: what does pizza have to do with marketing research?
The image on top of this post seems a bit random. It’s not. The slide is part of my session on measurement and scaling. We talk about multi-dimensional constructs. I ask them how they would measure the taste of pizza.
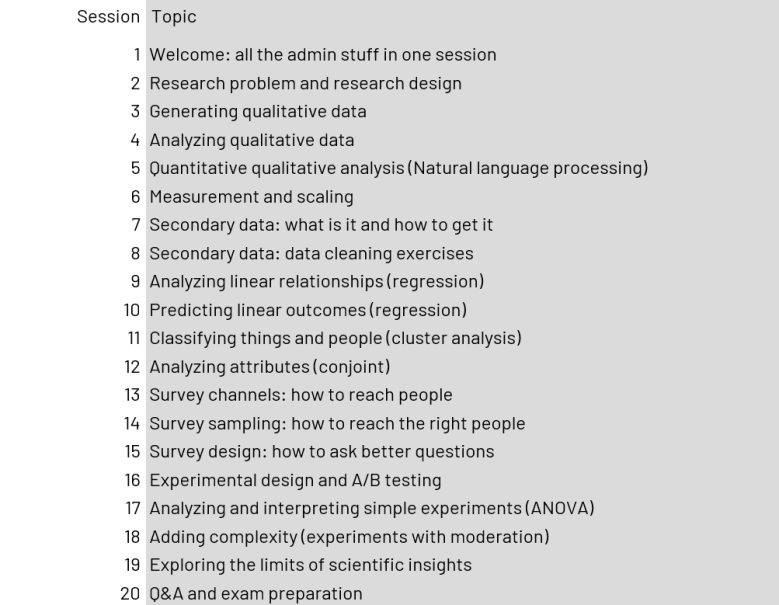
Attached: The syllabus
